THE QUICK CHECK.
Weather is about change that doesn’t last for at least 30 years.
Climate Change is about change lasting more than 30 years in one or more regions but not the whole world as was the case of The Medieval Warm
Global Warming or Cooling is about world wide change such as The Little Ice Age.
The Sahara Desert wasn’t the desert it is today when the pyramids were built. The light yellow area was grassland, the light green area was mixed woodland and grassland. The Fertile Crescent was green and cooler than today’s hot, arid land.
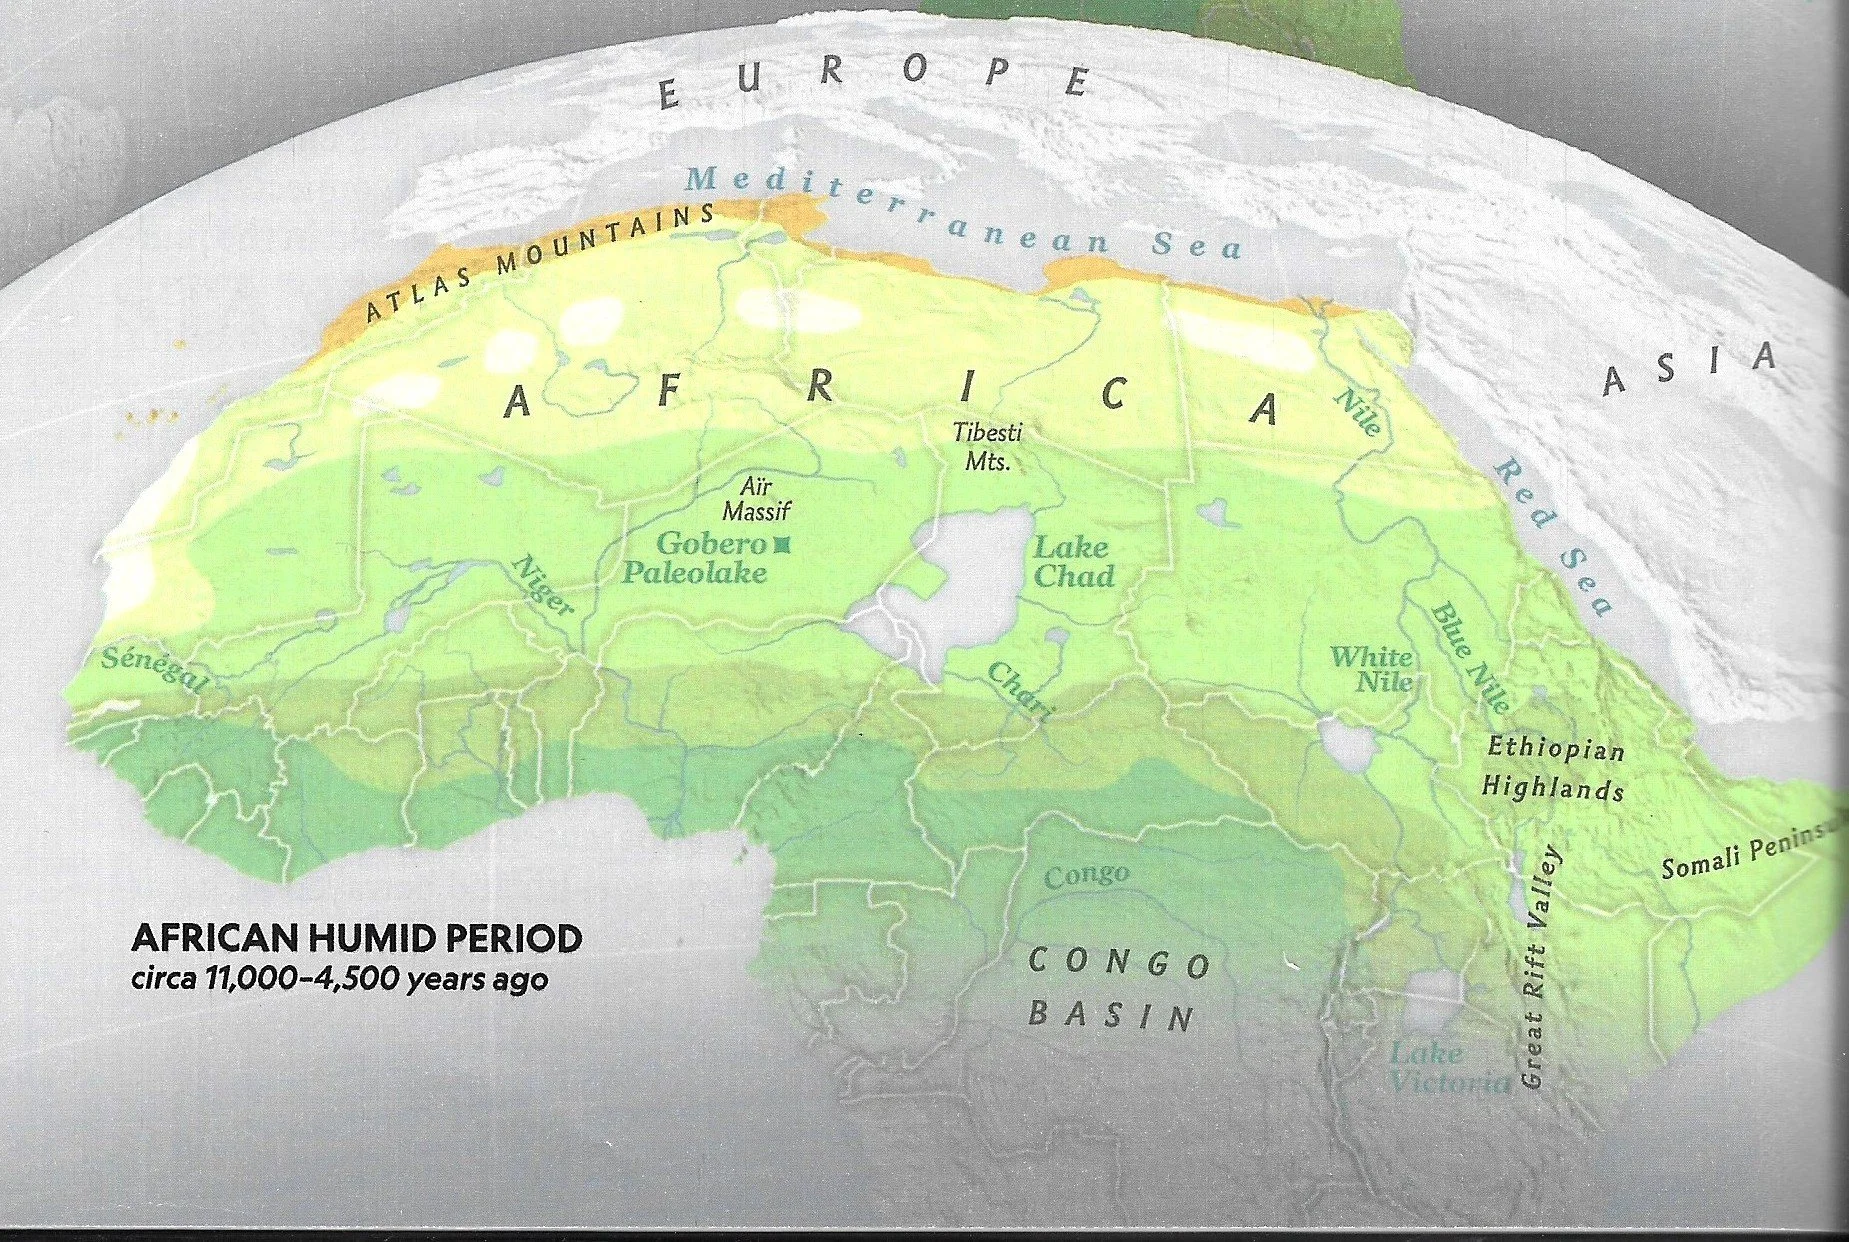
Courtesy of National Geographic, Volume 246.
WHY DO WE ONLY LOOK BACK 200 YEARS?
Nature has been causing huge climate change swings for hundreds of millions of years. Yet our climate change conversation only goes back 200 years - not even a blink in earth’s history. It’s the perfect starting point for those who want to dramatize the temperature increase since 1830 CE and ignore the fact that 200 years ago marked the end of The Little Ice Age, coldest period in the last 10,000 years. We are still below the earth’s 10,000 year average temperature.
A TIME LINE OF TEMPERATURE AND CARBON DIOXIDE CHANGE
10,000 years ago the world was hotter than today. It stayed hotter for the next 4,000 years. Carbon dioxide was just over half of what it is today.
6,000 years ago the temperature dropped to what we have today and stayed that way for the next 4,000 years. Carbon dioxide was still far below today’s level.
2,000 years ago the temperature began a long descent to the start of The Little Ice Age 550 years ago. The carbon dioxide levels didn’t change.
275 years ago carbon dioxide began to rise at the start of the industrial revolution. Temperature didn’t start to rise until 80 years later, the end of the Little Ice Age.
500 MILLION YEARS of climate history shows that global temperatures were much hotter than today - except during the ice ages shown at the far right. Carbon Dioxide was also higher. The Arctic, Greenland and Antarctica were ice free most of the time.
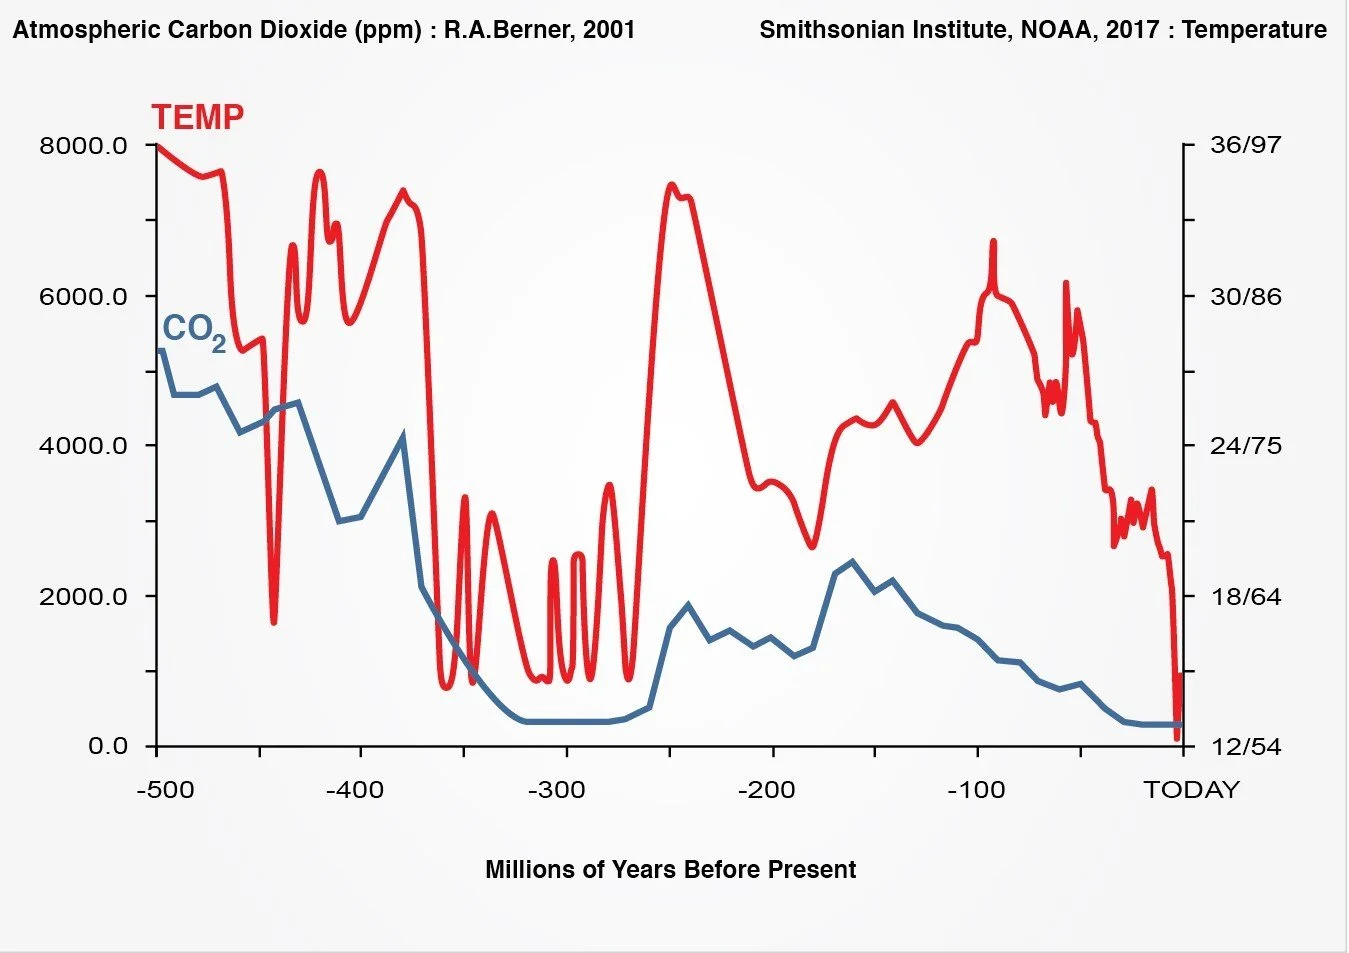
Graph created for this website by overlaying Dr. Robert Berner’s carbon dioxide data on a Smithsonian Institute graph showing temperature data from NOAA.
PLANTS Carbon dioxide is for plants what oxygen is for us. Carbon dioxide levels during the ice ages was starvation level for most plants. Plants thrive in higher levels of carbon dioxide. Their ideal level is four times higher than today’s level. Many greenhouses operate at carbon dioxide levels two to three times higher. Workers do not require special breathing apparatus to work those enriched carbon dioxide environments.
Rising levels of carbon dioxide make plants more productive which is helping feed our ever increasing global population. We also benefit by the more productive plants producing more oxygen. “From a quarter to half of Earth’s vegetated lands have shown significant greening over the last 35 years largely due to rising levels of atmospheric carbon dioxide.” NASA
JURASSIC PERIOD carbon dioxide levels were three to four times higher than today as shown in the 500 Million Year graph above. The fossil records show that dinosaurs thrived. Plants thrived. Coral, clams and shell fish thrived. The oceans did not become acidic because of higher temperatures and the much higher levels of atmospheric carbon dioxide.
WHAT ARE CLIMATE SCIENTISTS SAYING ?
In April, 2003 a ice core research team led by Dr. Caillon discovered that carbon dioxide did not lead temperature - on the contrary, temperature led carbon dioxide.
“CO2 increase lagged Antarctic deglacial warming by 800 +/- 200 years”.
In August, 2008 a research team led by Dr. Florides confirmed Dr. Caillion’s findings:
“Temperature rises first, followed by an increase in atmospheric CO2.”
Dr. Lovelock, a leader of the early carbon dioxide advocates, did something in 2014 scientists rarely do. He reversed his position and said it was a mistake to say carbon dioxide controls temperature. “We're no longer in a position to say that just because carbon dioxide rises … the temperature will rise likewise.” How could Dr. Lovelock and so many climate scientists have gotten it wrong in the 1990s? As Dr. Lovelock went on to say,
“We were carried away by the (correlation) between the ice cores of Antarctica.”
Dr. Lovelock was the head of science research at MI5 for two decades, Q at MI6 in the James Bond series.
IS CATASTROPHIC CLIMATE CHANGE IMMINENT ?
Melting sea ice in the Arctic and Antarctic Oceans cannot raise the sea level because they are floating ice which is simply water in a different form. While low altitude glaciers will melt, NASA says sea level, even with heat expansion, is predicted to rise about 1/10th of an inch (2.5 mm) per year. Scientists say we are a long way from the Greenland and Antarctic ice sheets melting.
Earth’s atmospheric temperature has risen 1.5 C (2.7 F) since 1830. The upper level ocean temperature (200 m, 660 ft deep) has risen only 1 C while the vast, deep ocean has stayed about 4 C (39 F). “The ocean’s heat capacity is about 1,000 times greater than that of the land and atmosphere.” Dr. Lovelock, who also said, “further gradual global warming will probably happen, the ocean’s ability to absorb heat shows that catastrophic global warming is highly unlikely”.
THE GREENHOUSE GASES
An IPCC graph shows two types of man made greenhouse gases: those that heat, those that cool. Subtracting the coolers from the heaters leaves only carbon dioxide and methane. They’re also trace gases, a tiny fraction of earth’s atmosphere. As of July, 2026 carbon dioxide plus methane had the heating ability 500 carbon dioxide molecules per million molecules of air.
Think of the numbers this way. 500 parts per million equates to 5 green tennis balls mixed in with 10,000 white tennis balls. Can 5 green tennis balls really heat and maintain the heat of 10,000 tennis balls? 3 those 5 balls were in the air before the industrial revolution. The climate was balanced, neither cooling nor warming. Then we added 2 balls. Could those 2 balls upset the cooling/ heating balance of 10,000 balls?
Water vapor (aka humidity) is also classified as a greenhouse gas. As a solid, snow and ice reflect the sun’s energy back to space. As a liquid, water droplets form clouds also block solar energy. Water vapor slows long wave heat energy’s escape from earth. There are 350 humidity tennis balls within 30 degrees of the sun being directly overhead, half of the planet’s surface.
With low humidity, deserts are scorching hot by day and chilly at night. With high humidity, jungles are hot during the and hot at night. NASA and the IPCC agree that humidity is the dominant greenhouse gas.
The Greenhouse Gases Are What Gets Heated
- - - - - - - - - - - - - - - - - - - - -
Radiative Forcing Is How They Get Heated
Humidity, carbon dioxide and methane are what gets heated. How they get heated is called Radiative Forcing. Incoming short wave solar energy (yellow arrows) heats the land and sea. Some of the solar energy is absorbed by land and ocean. Whatever isn’t absorbed is released as long wave energy which warms the greenhouse gases as it works its way up and out of the atmosphere.
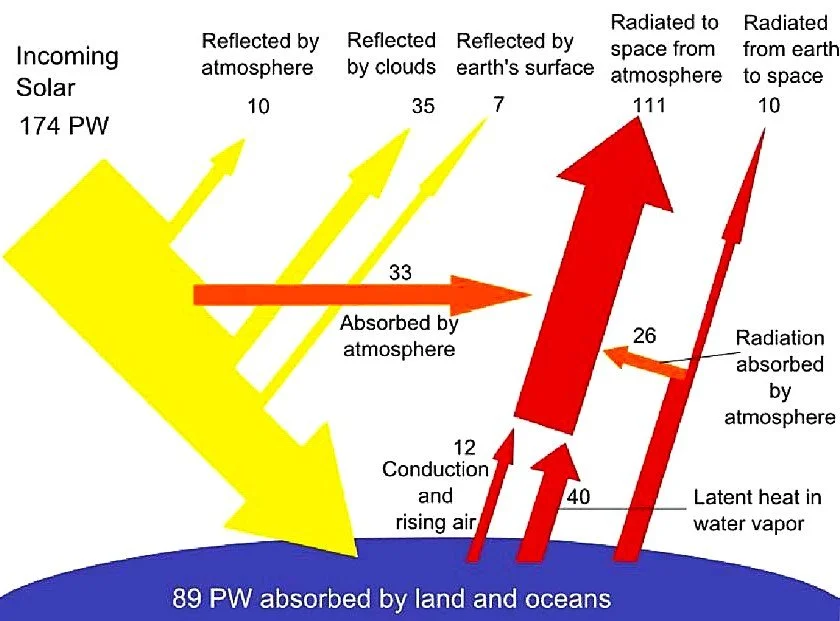
Graph by Frank van Mierlo : PW is a petawatt, one billion million watts of energy.
COOLING THE PLANET
Thermals are rising columns of warm air carrying heat energy high into the sky. They’re what birds and gliders ride to gain altitude the easy way. Rising columns of dry air cool releasing heat energy. Humid air releases huge amounts of energy when humidity condenses into water droplets.
Radiative Cooling moderates Radiative Forcing’s ability to turn the planet into a furnace. Quoting NASA, “If the temperature of the Earth rises, the planet rapidly emits an increasing amount of heat to space”. It’s like cruise control in a car. The physics are explained in The Deep Check version of this website and at this NASA site, keyword search proportional.
A SUMMARY OF TODAY’S CLIMATE SCIENCE
6,000 to 10,000 years ago our planet was a full degree Celsius (1.8 F) hotter than it is today (2020 - 2026). Greenhouse gases were just over half of what they are now without any input from humanity.
Advances in ice core analysis show that temperature leads carbon dioxide by 800 years.
Radiative Forcing heats the atmosphere and is a major factor of weather.
Radiative Cooling and Thermals cool the planet.
RECENT CLIMATE CHANGE DISCOVERIES
EARTH’S ORBIT Dr. Milankovitch proposed a ground breaking theory in three parts:
Orbital Eccentricity: Earth’s orbit around the sun changes from round (milder summers and winters) to oval (more extreme seasonal variations) in 100,000 year cycles.
Axial Obliquity: How far the earth tilts toward and away from the sun between summer and winter varies in 41,000 year cycles.
Axial Precession: The earth also leans like a wobbling top toward and away from the sun in a 26,000 year circle. It’s currently warming the southern hemisphere more in its summer than the northern hemisphere in its summer.
They are believed to have a major impact on earth’s climate but are of little relevance to our changing climate because their effects take many thousands of years.
Images courtesy of NASA in collaboration with Florida Atlantic University.
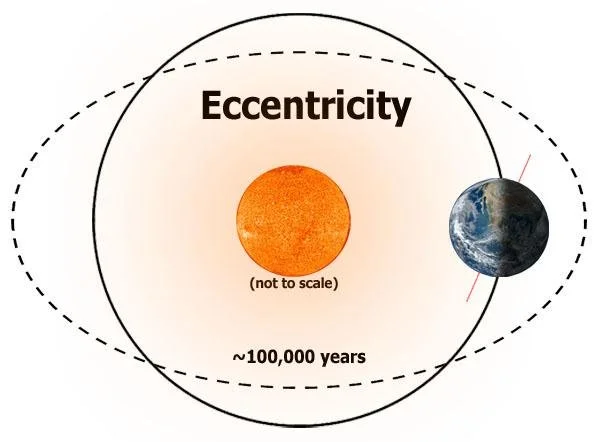
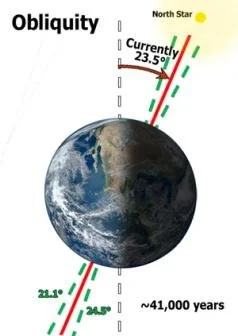

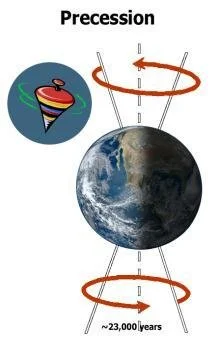
Highly accurate technology and computing power have confirmed Dr. Milankovic’s theories. Climate scientists have noticed a loose correlation between cooling alignments and the ice ages of the last two and a half million years. Research is investigating how much these three factors can heat and cool earth’s climate. Yet the Milankovic Cycles have been in motion for hundreds of millions, if not billions, of years. Their cycles don’t explain why earth’s climate has been so much cooler for the last two and a half million years.
CASSIOPEIA’S Wandering Star
Recent astrophysics research found a star (HD 7977) of the Cassiopeia Constellation passed close enough to our solar system 2.8 million years ago to disturb the orbits of our giant outer planets. Their orbital wobbles in turn disturbed earth’s orbit and occurred shortly before the start of the current progression of ice ages and interglacial warm periods (including the one we live in).
EARTH’S MAGNETIC POLES
Another interesting relationship is the correlation between climate change and the movement of earth’s magnetic north pole. In 200 AD (red dot upper left) earth’s magnetic north pole was located on the coast of Siberia. The middle east was referred to as The Fertile Crescent, then a green and temperate region. By 750 AD the magnetic north pole had moved to the northern tip of Canada’s Baffin Island. The middle east had become hotter and dryer. In 1,000 AD the magnetic north pole was at the geographic north pole. Europe and some other parts of the world were experiencing the Medieval Warm. By 1,500 the magnetic north pole was in the Arctic Ocean slowly migrating to Canada’s northern coast. The Little Ice Age began. The magnetic north pole stayed near Canada’s north shore until fifty years ago when it began to move rapidly north and west toward Siberia. Now it’s closer to Siberia than Canada again and the world is warming.
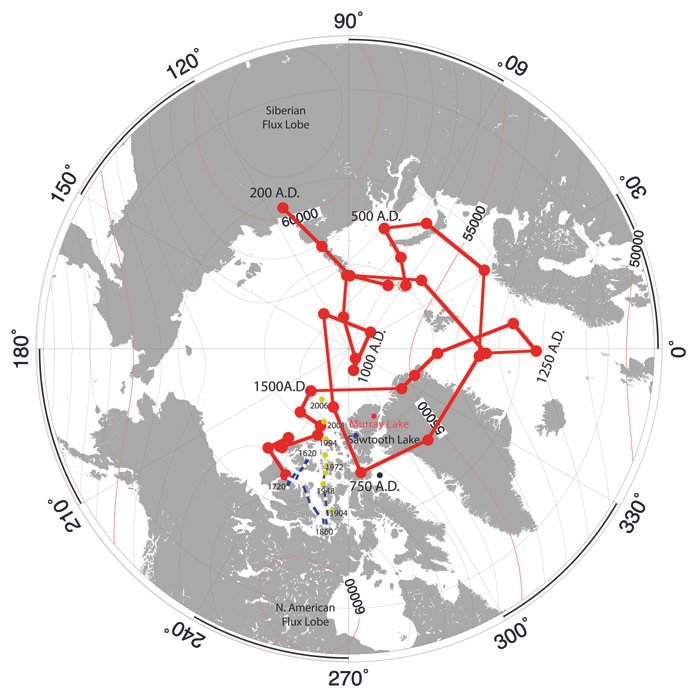
Researchgate.net, Public Domain Each dot represents a 50 yr. progression.
Is the correlation between climate change and pole movement just a coincidence or is it suggesting a real possibility? “Analysis of the movement of the Earth's magnetic poles over the last 105 years demonstrates strong correlations between the position of the north magnetic, and geomagnetic poles …. Although these correlations are surprising, a statistical analysis shows there is a less than one percent chance they are random …” (A. K. Kerton, 2009)
GRAVITY WAVES
Recent research found that the movement of earth’s magnetic poles is causing gravity waves that affect earth’s very high altitude magnetic radiation shield. This in turn effects the upper atmosphere. Other researchers found that changes in the upper atmosphere effects the lower levels of the atmosphere, the stratosphere and the troposphere. This is where our weather happens.
THE SUN
Yet if everything currently known about climate change conspired to reach its maximum cold phase at the same time, it still wouldn’t be cold enough to explain the abrupt 1,200 year long plunge back to the near ice age temperatures during the Younger Dryas (12,700 to 11,500 years ago). What caused that abrupt plunge and equally fast recovery? Could it happen again? The simplest explanation is the sun. We’ve always been told the sun’s strength doesn’t change. It might be time to rethink that.
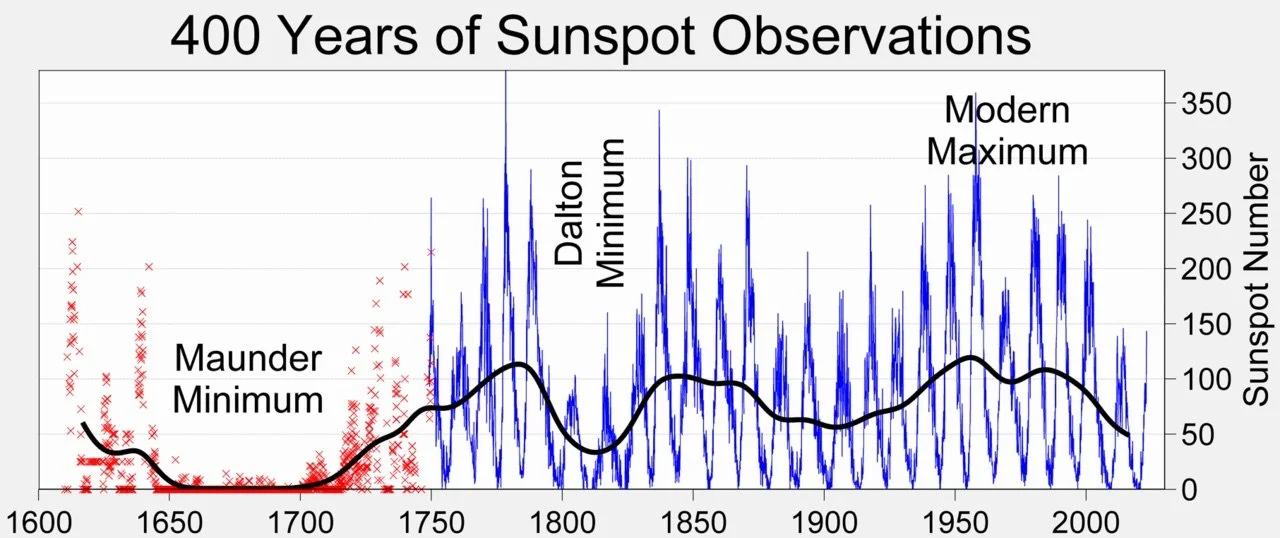
It’s been known for centuries that the sun’s north and south poles reverse like clockwork every eleven years. When they reverse there is a sharp rise in sun spot (solar storm) activity as shown in the even march of the blue spikes. The black line shows the moving average number of sun spots. During the Maunder Minimum it flat-lined which coincided with the coldest part of the Little Ice Age. The Dalton Minimum also had significantly fewer sun spots and was the last cold phase of the Little Ice Age.
“The correlation between the sun’s strength and temperature for 660 years indicates a 98% probability that the Little Ice Age was caused by variations in the sun’s strength. If the period is limited to 1650 to 1890, the probability increases to 99.99%.” (Dr. W.K. Schmutz)
QUICK EMISSION FACTS
Total Global Carbon Dioxide Emissions in 2022: 889 Gigatons
Natural Sources 95.5% Human Sources were 4.5%
Fossil Fuel Emissions were only 4.3% of the total global carbon dioxide emissions.
Gasoline combustion emissions were 1% of the total global carbon dioxide emissions.
Converting every gasoline engine to battery power world wide would reduce today’s atmospheric carbon dioxide from 425 ppm to 421 ppm which is where it was in 2023.
Springer, 2022 Data (shown here); IEA, Global Energy Review 2025, p.31
GLOBAL POPULATION GROWTH
1 billion in 1800 1.6 billion in 1900 5.4 billion in 1950 6.1 billion in 2000 8.1 billion in 2024
The global population is expected to reach 10 billion in 25 years.
The carbon dioxide (red line) and population (blue line) are strikingly similar to the carbon dioxide - temperature curve seen in many online graphs.
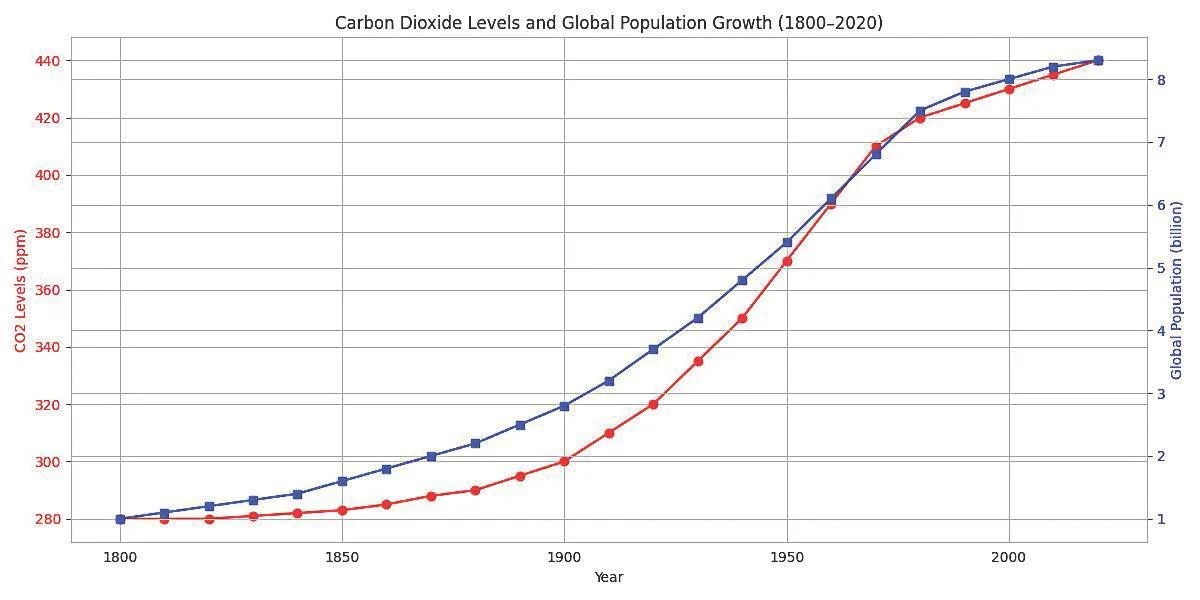
Graph created by Gemini in 2025 for this website.
Will the global population increase of 25% from 8 to 10 billion cause atmospheric carbon dioxide to increase 25% too? Perhaps the question to ask is why wouldn’t the population increase cause a corresponding increase in carbon dioxide?
LOOKING AHEAD
We’ve had 450 years of very slow climate change causing generation after generation to believe the climate doesn’t change. Now it appears to be changing. Research since 2003 has led many climate scientists to believe carbon dioxide and the other greenhouse gases are neither the sole cause nor the dominant cause of climate change.
Yet politicians and the green industry are fixated on limiting the greenhouse gases, especially carbon dioxide which it believes is the main culprit. That appears to be wishful thinking in the face the anticipated population surge. Should the trillions of dollars intended to limit the greenhouse gases increases and compensate third world nations which have benefited greatly from first world technology be redirected to readying the world for the gradual inch per decade rise in sea level predicted by NASA and a world with more extreme weather?
More topics and more detail about each topic is available in THE DEEP DIVE version.
Email comments to: climate.reality.123@gmail.com